The Audit and Review group has the responsibility for the monitoring, oversight and analysis of data.
Child protection systems
Child protection data is routinely examined by children’s services and findings shared and analysed as required across the partnership, via sub-groups.
As of March 2025, there were 649 children with a child protection plan (CPP) in Leeds, equating to a rate of 37.3 children and young people with a CPP per 10,000 children aged 0-17. This is a decrease from 674 in March 2024, a rate of 38.7, with the rate for England for 2024 being 41.6.
When official data is published later in the year, we anticipate the Leeds rate will remain below national, regional core city and statistical neighbour averages. The comparative rates per 10,000 for children on a child protection plan for March 2024 were:
- Leeds: 38.7
- Core cities: 53.2
- Statistical neighbours: 50.1
- Yorkshire and The Humber: 48.6
- England: 41.6
An analysis of children subject to a child protection plan at the end of March 2025 shows that children from ‘any other mixed background’ are over-represented in the cohort (6.6%) when compared to the January 2025 School Census (2.8%); and that children from ‘Black African’ background are under-represented (6.2% compared to 8.2%). More children with a ‘White British’ background are in the child protection cohort (62.7%) than in the School Census (57.6%).
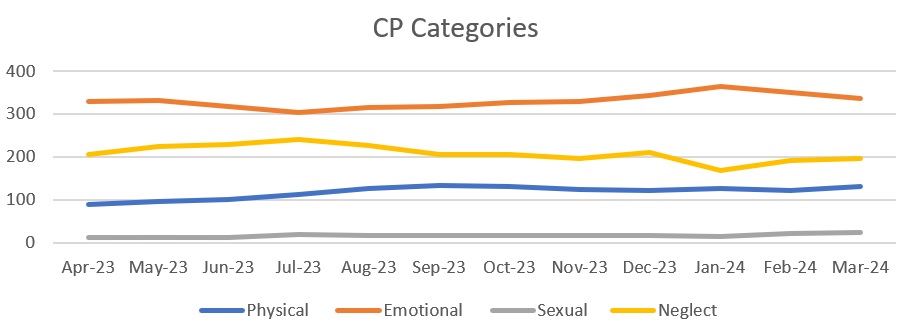
In line with previous years, the number of children experiencing emotional abuse remains the key reason of children being subject to a CPP in Leeds.
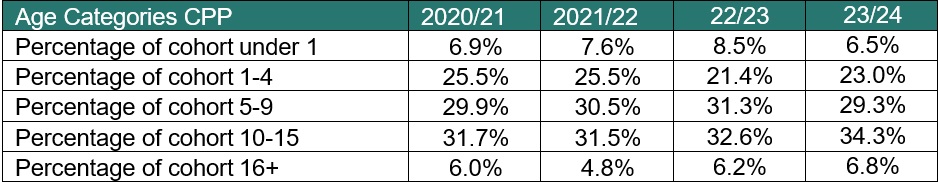
The cohort of children subject to a child protection plan is becoming older. Proportionally more children aged 10 upwards were subject to a plan at the end of March 2025 compared to March 2021 (45.2 per cent compared to 37.7 per cent), and fewer children aged four or under are subject to a plan across the same period (28.4 per cent compared to 32.4 per cent). The age bracket with the most children subject to a plan is the 10-15-year-old age bracket. This was the case at the end of March 2021 and March 2025, but there is a pronounced increase in the proportions: 31.7 per cent in March 2021, 36.7 per cent in March 2025.
Table Four- Child protection date by age
| Age categories CPP |
2020/21 |
2021/22 |
2022/23 |
2023/24 |
2024/25 |
| Percentage of cohort < 1 |
6.9%
|
7.6%
|
8.5%
|
6.5%
|
6.8%
|
| Percentage of cohort 1-4 |
25.5%
|
25.5%
|
21.4%
|
23.0%
|
21.6%
|
| Percentage of cohort 5-9 |
29.9%
|
30.5%
|
31.3%
|
29.3%
|
26.5%
|
| Percentage of cohort 10-15 |
31.7%
|
31.5%
|
32.6%
|
34.3%
|
36.7%
|
| Percentage of cohort 16+ |
6.0%
|
4.8%
|
6.2%
|
6.8%
|
8.5%
|
To ensure that the needs of children and families who require the support and safety of a child protection plan are addressed as quickly as possible, it is vital that these take place within an appropriate timescale. The full year data demonstrates that 77.5 per cent of all initial child protection conferences that were held in 2024/25 were within timescales, this is 29.5 percentage points higher than the 2023/24 full-year figure of 48.0 per cent.
From review child protection conferences, 78.3 per cent that were held in 2024/25 were within timescales, this is 10.0 percentage points higher than the 2023/24 full-year figure of 68.3 per cent.
There is ongoing work to continue to improve these figures and the Audit and Review group will continue to monitor this performance measure.
Children Looked After (CLA)
The latest official statistics are from the 903 Children in Care data for 2024. Leeds saw a greater rise in children looked after numbers than comparator groups in 2023/24: a 6.7% rise in Leeds compared to a 1.2% increase in Core Cities, and a -0.2% reduction for the England figure. Whilst Leeds compares well in terms of long-term trends, Leeds rate of increase between 2019 and 2024 is greater than all comparator groups (a rate per 10,000 an increase of 15.6% compared to the England rise of 7.7%). Leeds 2024 rate per 10,000 of 89 ranks 5th of 11 with statistical neighbours and 5tth of 8 Core Cities (with a rate per 10,000range from 57 to 155).
The age profile of the Leeds children in care population is similar to England. Children aged 10-17 make up 62% of our looked after population from 45% of our child population and ages 16 and 17 make up 24% of the Leeds care population and 11% of the child population.
Children from mixed ethnic backgrounds are over-represented in the care population and those from Asian backgrounds under-represented relative to the Leeds population.
Abuse or Neglect is the main reason why children start to be looked after in Leeds, consistently over 60% of cases, although this figure has reduced from 65% in 2020 with the 2024 England percentage being 56%. Whilst the Leeds proportion has slowly reduced over the last five years, the number of cases has grown by 28.6% (76 children) between 2020 and 2024.
In March 2020, there were 59 unaccompanied asylum-seeking children in Leeds, this figure reduced to 50 in March 2021 but rose to 125 in July 2024 before reducing by 21 (16.8 per cent) to 104 at the end of March 2025. Under the National Transfer Scheme Leeds’ current ‘threshold’ is 172.
Education
Published data for the 2023/24 school year reveals that the attendance rate for Leeds primary schools has increased to 94.4%; however, for the first time since 2010/11 is below the national rate (94.5%).
Attendance remains below pre-pandemic levels when it was 96%. Secondary attendance has increased to 90.5% in Leeds, but performance remains below national levels where there has been a slight improvement to 91.1%.
Missing over 10% of learning is recorded as persistently absent, and data demonstrates that this was the case for 15.6% of primary pupils, and 26.2% of secondary pupils in Leeds. It is important to note that both have reduced since 2022/23 bur remain higher than national averages.
Missing more than 50% of learning is recorded as severely absent and data demonstrates that this is the case for 0.8% of primary pupils, and 5.1% of secondary pupils in Leeds. The secondary figure is above the national average of 3.8%, but the primary figure is just below the national average of 0.9%.
Suspensions have increased post-pandemic. In the autumn term of the 2023/24 school year, the rate of suspensions in Leeds’ primary schools was 0.57%, below the national date of 0.83%, but higher than the 2022/23 Leeds figure of 0.34%. The secondary figure was 10.92% (8.19% nationally) against the previous year’s figure of 5.9%.
Children missing education (CME) are children of compulsory school age who are not registered pupils at a school and are not receiving suitable education otherwise than at a school. This could be for a range of reasons including children who are awaiting a school place and children in receipt of unsuitable education. The DfE started to collect information from LAs in England during 2022/23, these statistics are developmental with more to do on definitions and data capture to be assured of consistency. However, this does not diminish the importance of children in being in education.
In Leeds 1,170 children were recorded as missing education on census day in the 2024/25 autumn term (1.2%). This figure has reduced from a high of 1,510 (1.3%) recorded as missing education in the pervious autumn term school census.
A growing number of children are being educated at home. The local authority is notified of a child or young person becoming electively home educated (EHE) by the school. The number of notifications almost doubled in the academic year following the beginning of the COVID-19 and have remained high. At the end of March 2025, 1,519 children in Leeds were recorded as EHE, an increase of 185, or 13.9%, since March 2024. Reasons for home education include philosophical reasons, health-based reasons and dissatisfaction with local schools. Local authorities have no formal duty to monitor the provision of education at home, however, under section 436A of the Education Act 1996, they do have a duty to make arrangements to identify children in their area who are not receiving a suitable education.
In Leeds schools 3,864 pupils have an education, health and care (EHC) plan, 2.8 % of all pupils in Leeds, lower than England (4.8%), Core Cities (4.3%) and DfE statistical neighbours (5%). There are 21,335 pupils in Leeds schools which have SEN support, 15.6% of all pupils in Leeds, a similar proportion to the Core Cities average of 15.6% and higher than England (13.6%) and statistical neighbours (13.7%).
There are 6,328 children in Leeds who have an EHC plan at the end of March 2025, this is an increase of 681 (12.1%) since March 2024.
At the end of March 2025, 1,098 young people (5.62 per cent) were recorded as Not in Education, Employment or Training (NEET) in Leeds. This is 150 more than the March 2024 figure of 948 (5.08 per cent).